// CONTACT
The Don | Mad Men
CHALLENGES
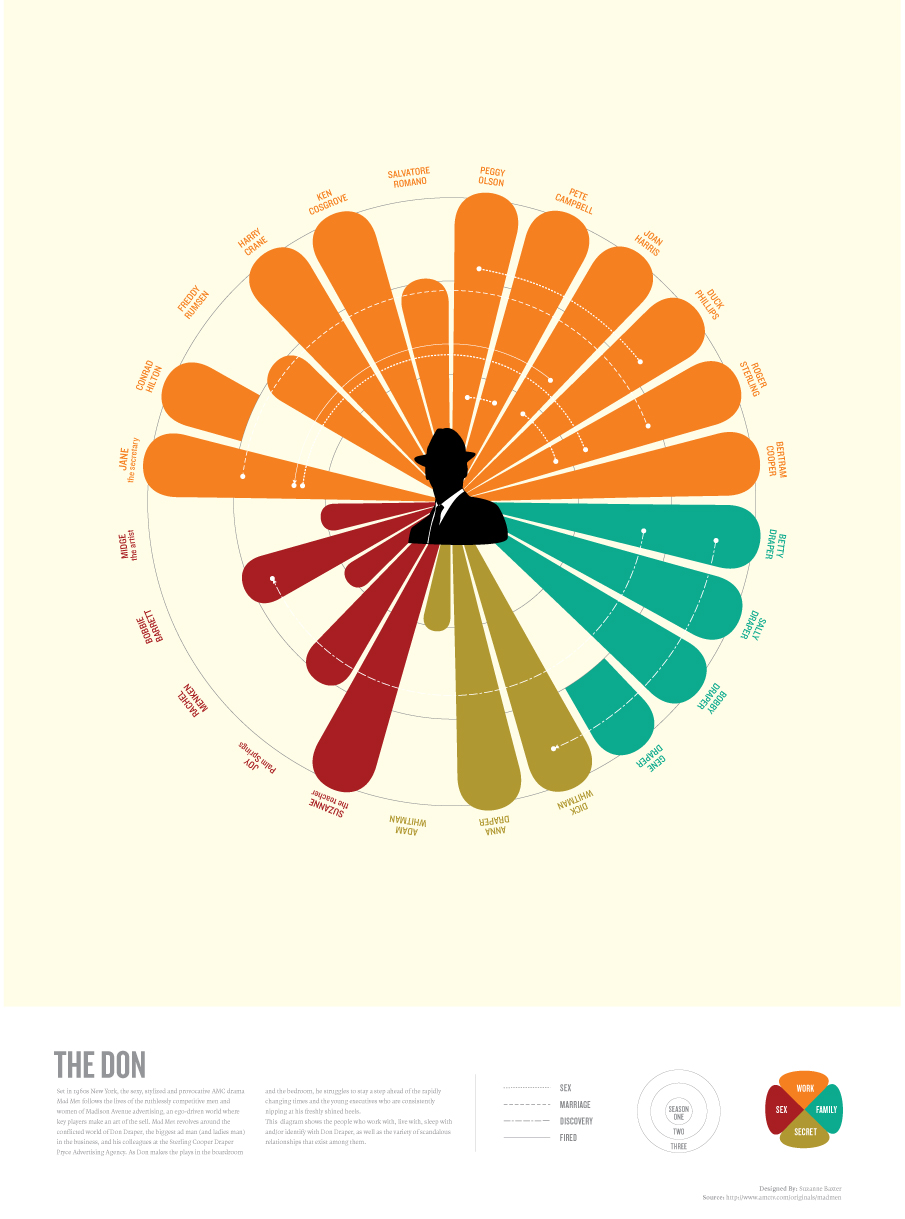
I wanted a different way to tell Don Draper’s story - using data visualization to look at his relationships in a unique way. It needed to be informational and have the Mad Men look and feel. RESULTS
I explored sipping bourbon at work and landed here. I set up a system of categories relating lifestyles and time, with Don Draper front and center. Looking at the data through this lens, combined with the sixties style, resulted in an infographic that pleases the eye at first glance, then provides the viewer with the inside story.